How to access Story Feed Analytics Dashboard?
- Log into VideoMyJob from your desktop web browser
- Select "Story Feed" from your side menu
- Then click on the "View Analytics" button in the top right corner

How to Navigate Analytics Dashboard?
Overview
This section gives you a snapshot of the "candidate experience" feedback, how much time was spent watching Story Feed videos ("Time Watched"), and how many "Video Views" your story feed received.
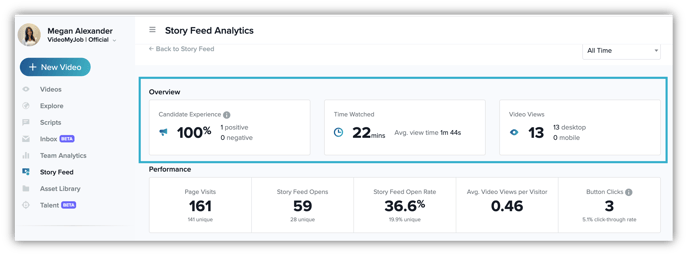
- Candidate Experience: Visitor responses to candidate feedback presented after closing the Story Feed - example of survey shown below👇

- Time Watched: Total time watched within the date range of all videos filtered the story feed source
- Avg. view time: total time ÷ number of video views (filtered by story feed)
- Video Views: total video views
- breakdown by mobile vs desktop
Performance
This section gives you breakdown of how your Story feed is performing across the following categories;
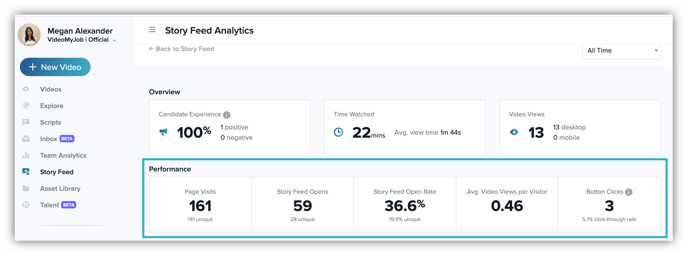
- Page Visits: total page visits
- Unique: unique page visits
- Story Feed Opens: total number of story feed opens
- Unique: unique story feed opens
-
Story Feed Open Rate: Story Feed opens ÷ page visits = %
-
Unique open rate: unique story feed opens ÷ unique page visits = %
-
- Avg. Video Views per Visitor: total video views ÷ unique story feed opens = #
- Button Clicks: total video button clicks + total hero button clicks = #
- Click-through rate: (total video button clicks + total hero button click) ÷ story feed opens = %
Unique = A unique visitor refers to a distinct individual in the reporting period, i.e. not counted more than once. In general, you will always have more total opens/visits than unique opens/visits.
Video Views Graph
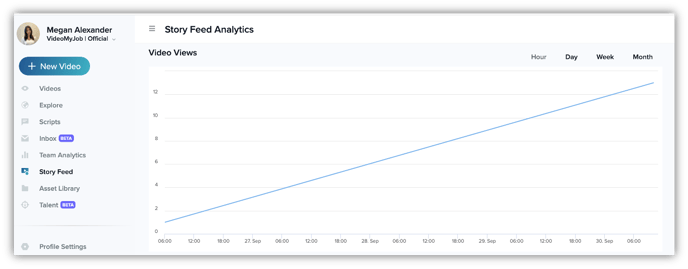
The Video Views graph displays the total aggregated Story Feed views within the filtered time frames - Day / Week / Month.
Most Viewed Videos & Most Popular Tags
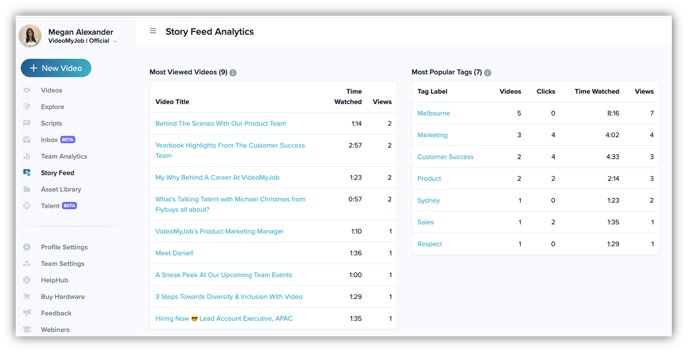
Most Viewed Videos is a list of all story feed videos that have been viewed during the filtered time frame. It's further broken down by the total time watched, and the number of views.
Most Popular Tags is a list of all the current tags that are assigned to the videos within the Story Feed.
Tooltip: Tags will be displayed if they are currently assigned to at least one video and have views or click data. Historic tags that are no longer in use will not be displayed.
By default, it's been sorted from the most views to the fewest views.
- Videos: Number of videos that tag is applied to.
- Clicks: Number of times the check box has been selected for that tag.
- Time Watched: Sum of time watched on all videos with that tag applied.
- Views: Sum of views for all videos with that tag applied.